This week I've been looking into some optimisations for a long-running process that chats to the database. Within the operation, the data isn't expected to change, so it would be reasonable that, where we make repeated calls, we cache the values and re-use them for the duration of the operation. I've been using SQL Profiler to identify them and wanted to blog the method for reference.
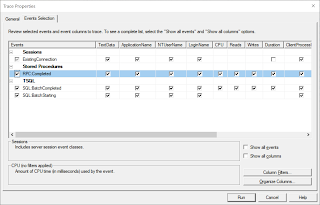
First, start up SQL Profiler and create a new trace. Connect to the database and define the Events Selection. I kept most things related to data reads and writes:
I then ran the application, set a break-point in the code at the point where afterward I was interested in the results, and attached the debugger.
On hitting the breakpoint, I started the trace and continued the code execution. When the operation was complete I could stop the trace.
To analyse the data, I saved it to a new table in a database I created to store the results in, via File > Save As... > Trace Table
I then created a view on the table, that filtered out some of the records and columns that weren't of interest:
CREATE VIEW vwTraceData
AS
SELECT RowNumber,Convert(varchar(max),TextData) TextData,StartTime,EndTime
FROM TraceData
WHERE ApplicationName = '.Net SqlClient Data Provider'
AND TextData NOT LIKE '%--%'
AND TextData NOT LIKE '%exec sp_reset_connection%'
AND TextData NOT LIKE '%SET LOCK_TIMEOUT%'
The TextData column was converted to varchar(max) to allow joining from the column.
From the data it's possible to see which SQL calls are being repeated:
SELECT TextData,Count(*) Occurances
FROM vwTraceData
GROUP BY TextData
ORDER BY Occurances DESC
And by repeating the operation and saving into a new table, I could compare to see if my optimisations had the necessary effect:
SELECT v1.TextData,Count(*) V1Count,V2Count
FROM vwTraceData v1
INNER JOIN (
	SELECT TextData,Count(*) V2Count
	FROM vwTraceData2
	GROUP BY TextData
) v2 ON v2.TextData = v1.TextData
GROUP BY v1.TextData,V2Count

Comments
Post a Comment